Awareness — Name the Problem
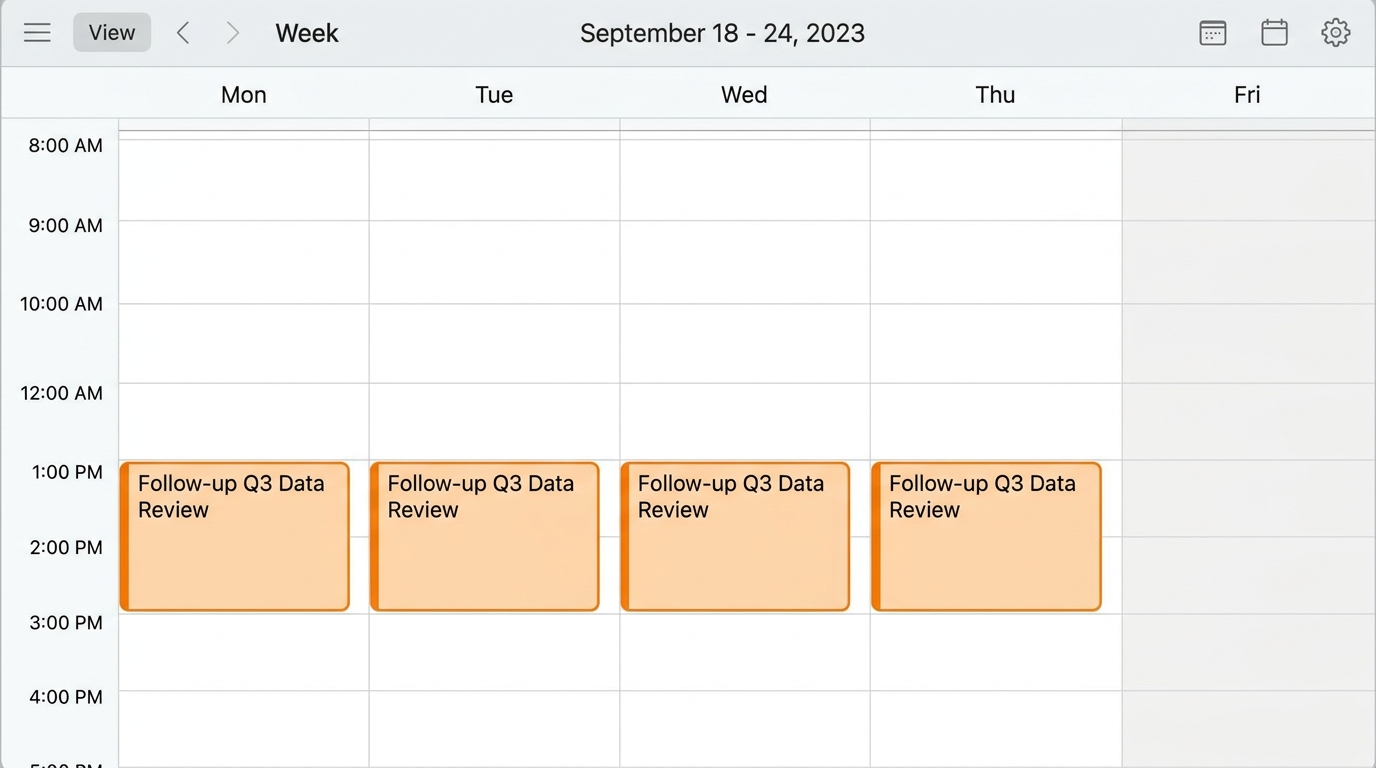
Ad 1 of 12 — "Forty-Seven Slides" — Single Image
Your team walks into the quarterly review. The data is thorough. The deck is polished. Forty minutes later, the room agrees to "circle back next week."
The data was never the problem. The structure was.
Duarte has trained teams at 200 Fortune 500 companies to present data that gets a yes in the room. Not after three follow-up meetings.

Frameworks:
PAS
Hook: Narrative
Value: Dream Outcome + Perceived Likelihood
v1 → v2: "Your data is right. Your room isn't moving" → "47 slides. 12 charts. Zero decisions." You can count 47 slides. You can't point at "room isn't moving." (Harry Dry Rule 1: Visualization)
Ad 2 of 12 — "Circle Back" — Single Image
If your team's data presentations end with follow-up meetings instead of approvals, the problem isn't the data.
It's the gap between having the right numbers and structuring them into a recommendation that moves the room.
Duarte's two-day Presenting Data Insights program closes that gap. 9 out of 10 participants apply the frameworks in their next presentation.
Frameworks:
PAS
Hook: Conditional
Value: Dream Outcome + Time Delay
v1 → v2: Headline cut from 85 chars to 39 chars. Removed unfalsifiable filler ("across industries and seniority levels"). Added specific stat: "9 out of 10 apply in their next presentation." (LinkedIn specs + Kaplan's Law + Rule 2: Falsification)
Ad 3 of 12 — "The Data Dump" — Video
There's a name for what happens when someone puts 47 charts on screen and reads them aloud. It's called data dumping.
The fix takes two days.
Duarte's Presenting Data Insights program teaches teams to cut the noise, build one clear recommendation, and deliver it so the room acts. 35 years of Fortune 500 training behind every framework.
Open on Maegan, mid-shot, warm but direct energy. No smile yet.
I'm going to describe a meeting and you tell me if you've been in it.
[beat, slight head tilt]
Someone shares their screen. Forty-seven slides. Every chart they've ever made. They read each one out loud, like it's storytime for executives.
[knowing look]
The data is great. It's thorough. It's well-sourced. Nobody's questioning the numbers.
Slight lean, tempo shifts — this is the turn
And forty minutes later, the most senior person in the room says, "Great work. Let's circle back next week."
[pause — let it land]
That's not a compliment. That's your data going to die in someone's inbox.
Now the energy picks up — authority mode
We have a name for this at Duarte. We call it data dumping. And it's the single most common reason smart teams with good numbers don't get the yes in the room.
The problem is never the data. It's that nobody was taught how to turn data into a recommendation.
Direct to camera, confident, almost casual
That's what we do. Two days. Your team's actual data. Your team's actual audience. They walk out knowing how to build one clear recommendation and deliver it so the room acts on it.
Not next week. In the meeting.
Version B — Spicy
Open tight on Maegan. No warmup. She's already mid-thought.
I sat through a presentation last Tuesday where someone showed forty-seven slides of quarterly data and then asked the room, "Any questions?"
[deadpan]
Yeah. I had a question. What was I supposed to do with any of that?
[beat]
But nobody said that. You know what they said? "Really thorough. Great work." And then everyone opened their laptops and started doing email.
Slight lean — she's diagnosing now
Here's what's actually happening in that room. The presenter thinks more data equals more credibility. The audience thinks if I sit here long enough, this will end. And the decision that was supposed to happen? It gets an email thread. Which gets a follow-up meeting. Which gets another email thread. And three weeks later someone on Slack goes, "Wait, did we ever decide on this?"
[knowing pause]
No. You didn't. Because nobody in that room was presented with a decision. They were presented with a spreadsheet in landscape mode.
Now she shifts — authority, not performance
We call it data dumping. And I've watched it happen at companies you'd assume would know better. Fortune 100 companies. Brilliant analysts. World-class data. Meetings that go absolutely nowhere.
The fix is not "be a better presenter." The fix is learning how to take forty-seven slides and turn them into one sentence that starts with "I recommend."
Direct to camera — this is the close
That's what we teach. Two days. Your team's data, not some case study from 2014. And by day two, they're delivering that recommendation out loud to a room that's actually paying attention.
Because they were taught to present a decision. Not a document.
Script: Maegan to-camera, 60 seconds. Corporate Natalie energy with authority — names the meeting everyone's been in, diagnoses "data dumping," pivots to the fix. Ready for teleprompter.
Frameworks:
HSO
Hook: Label
Value: Dream Outcome + Effort/Sacrifice
Hormozi: Pain is the Pitch
v1 → v2: Reframed around "data dumping" as a named, concrete problem. Added "The fix takes two days" (Hormozi: reduce Time Delay). YouTube embed replaces static placeholder.
Ad 4 of 12 — "Four Myths" — Carousel
4 reasons your team's data presentations end without decisions.
1 / 5
4 reasons your team's data presentations end without decisions
Duarte | 35 years training Fortune 500 teams
2 / 5
"We need more data."
No. You need one clear recommendation. Your audience doesn't decide from 47 data points. They decide from one well-framed insight.
3 / 5
"The charts tell the story."
Charts display information. Stories move people. The difference between a chart and a data story is the difference between a spreadsheet and a standing ovation.
4 / 5
"Presentation skills are soft skills."
When a $2M initiative stalls because the data wasn't framed for the CFO, nobody calls it soft. They call it a missed quarter.
5 / 5
Presenting Data Insights
Two days. Two methodologies. One outcome: your team presents data that gets a yes in the room.
9.2/10 participant satisfaction.
Schedule a Consultation →
Frameworks:
AIDA across cards
Hook: List
Value: Dream Outcome + Perceived Likelihood
v1 → v2: Replaced weak myth ("good data speaks for itself" — everyone already doubts this) with stronger contrast ("chart vs data story = spreadsheet vs standing ovation"). Card 4 now passes Falsification: "$2M initiative stalls" is specific and falsifiable. Added 9.2/10 stat to CTA card.
Consideration — Show the Solution
Ad 5 of 12 — "TED and Your Team" — Video
Maegan Stephens co-created Duarte's Adaptive Listening methodology, coaches at UT Austin's McCombs MBA program, and just spoke at TED 2025 in Dubai.
That's the caliber of expertise behind every Duarte facilitator.
Presenting Data Insights combines DataStory (build the narrative) with Captivate (deliver under pressure). For teams of 10 to 200+.
Version B — Spicy
Maegan sitting casually, like she's telling a friend a story she can't believe.
I need to tell you about the last corporate training I observed. Not one of ours. Someone else's.
[settles in]
The facilitator opened a PDF. Read it. Out loud. To a room full of directors who can, in fact, read. Then she said, "Let's break into groups and discuss what we just learned." Ma'am, we learned that you're reading a PDF.
[pause — slight disbelief]
The workbooks went straight into tote bags. The tote bags went under desks. By lunch, three people had quietly opened their laptops to do actual work. And the evaluation forms? "Very informative." Which is corporate for "I have chosen not to make enemies today."
Now she gets serious — this is the contrast
That's what most presentation training looks like. And L&D leaders know it. You've sat in the back of that room watching your budget get read aloud from a PDF. You know exactly what I'm talking about.
So here's what we do differently. And I'm not going to be modest about it.
Confident, stacking credentials like facts not brags
I have a PhD in communication. I've coached executives at McCombs for twelve years. I spoke at TED last year. And I still personally facilitate workshops. Because I think the person teaching your VP of Finance how to present to the board should have actually presented to a board.
Your team shows up with their data. Their audience. Their actual presentation. And in two days, they walk out knowing how to build the story and deliver it under pressure. Not hypothetically. They practice it. Out loud. With someone who will tell them the truth.
Direct to camera — wry
No PDFs. No tote bags.
Script: Maegan to-camera, 45 seconds. Corporate Natalie energy with PhD authority — roasts generic corporate training, then credential-stacks (PhD, McCombs, TED Dubai, still facilitates personally). Closes with program structure. Ready for teleprompter.
Frameworks:
BAB
Hook: Statement
Value: Perceived Likelihood + Effort/Sacrifice
v1 → v2: Full credential chain (PhD + TED 2025 + McCombs + Adaptive Listening). YouTube embed replaces static placeholder. Only Duarte has THIS credential stack. (Harry Dry Rule 3: Nobody Else)
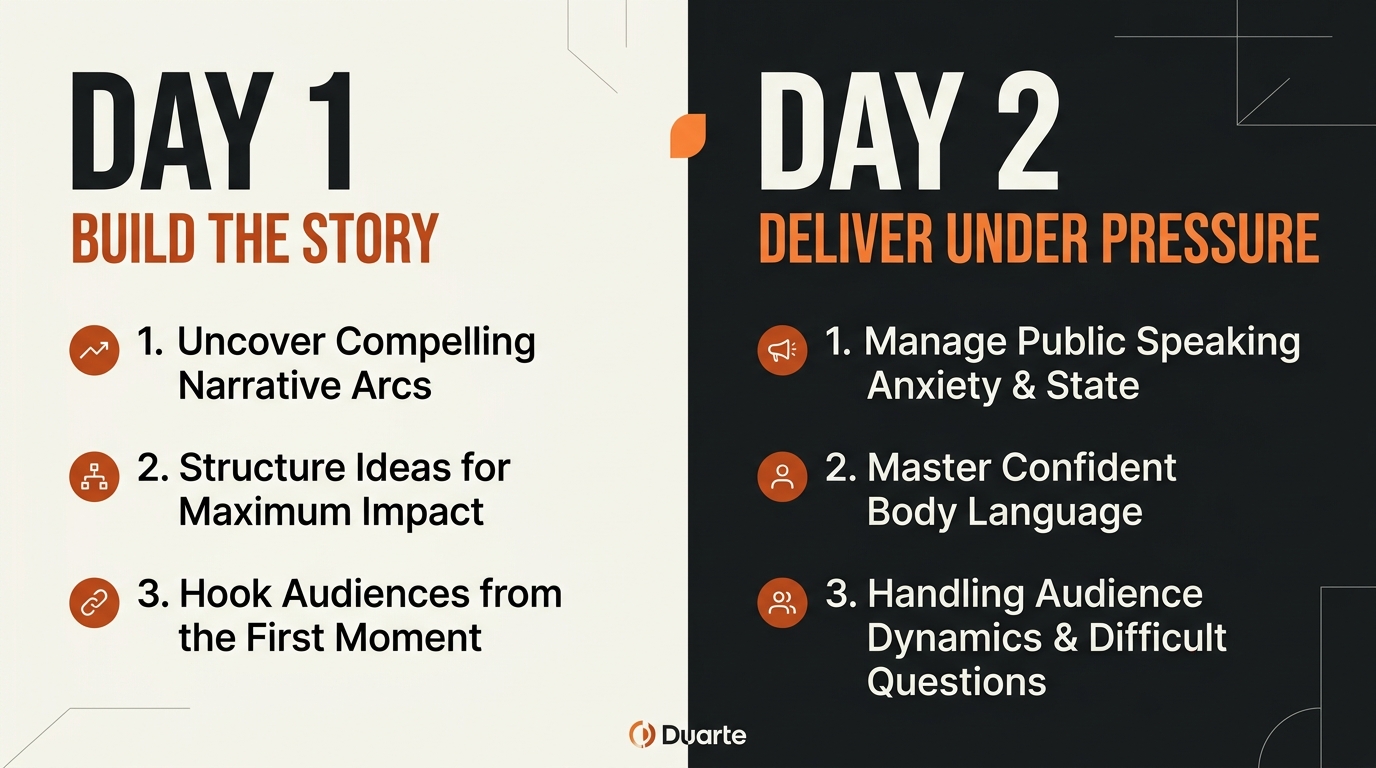
Ad 6 of 12 — "Day 1. Day 2." — Single Image
Day 1 — DataStory: Your team takes their own data and builds a recommendation using Duarte's Big Idea framework. Not theory. Their actual numbers, their actual audience.
Day 2 — Captivate: They deliver that recommendation in a live simulation. Facilitator feedback. Real-time refinement. The practice round before the real meeting.
9/10 participants say they apply the frameworks in their next presentation.
Frameworks:
BAB
Hook: Contrast
Value: Dream Outcome + Time Delay + Effort/Sacrifice
v1 → v2: "Most data training stops at the slide" → "Day 1: Build the story. Day 2: Deliver under pressure." The old headline fails Falsification (the opposite sounds equally plausible). New headline is concrete and visual. "Their actual numbers, their actual audience" passes the Pointing Test. (Harry Dry Rules 1+2)
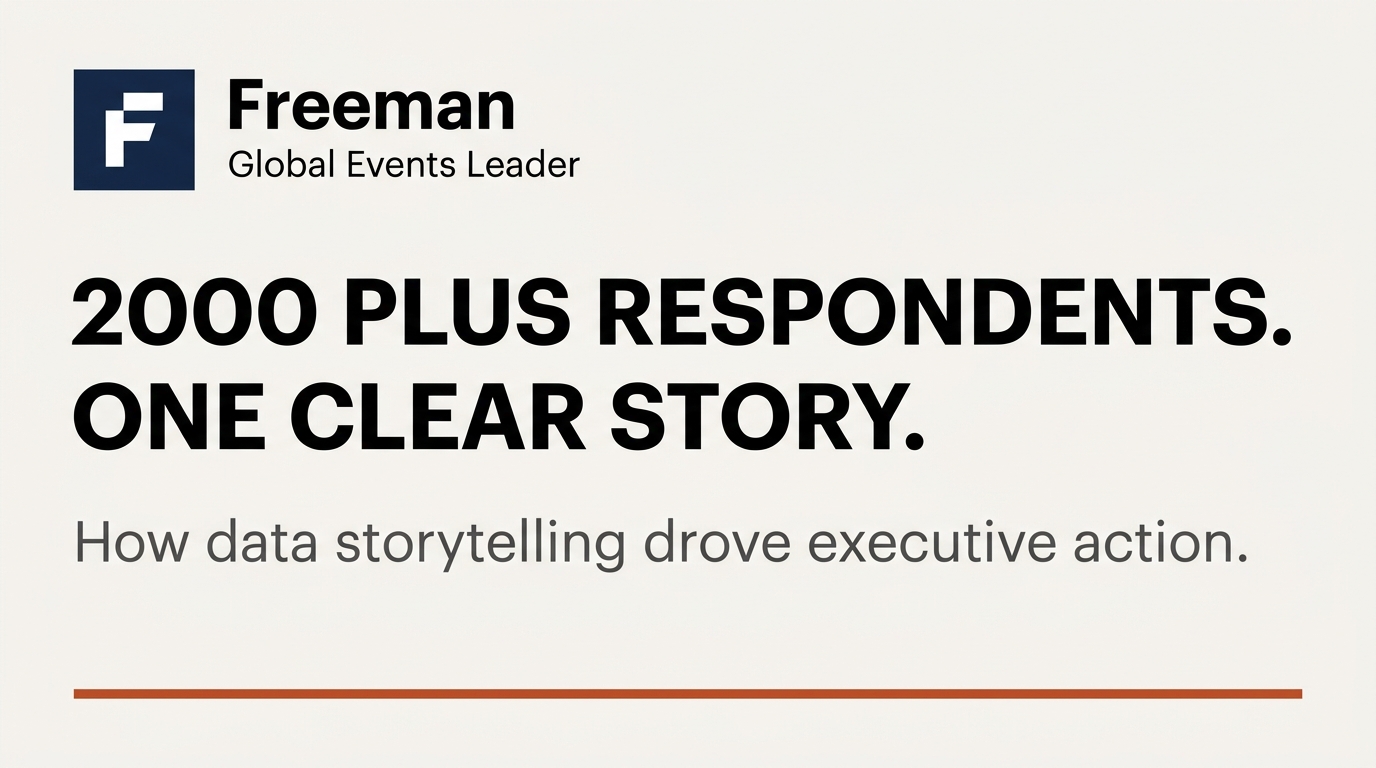
Ad 7 of 12 — "Freeman" — Case Study
Freeman surveys 2,000+ respondents every quarter. The data was excellent. The executive team wasn't moving on it.
After applying Duarte's data storytelling methodology, their quarterly reports became strategic narratives. Their CMO now co-presents with Duarte CEO Nancy Duarte on how data storytelling reshaped a $1.5 trillion industry.
Your team has the same gap. Great data, not enough action.
Frameworks:
HSO
Hook: Narrative (Time + Place)
Value: Perceived Likelihood + Dream Outcome
v1 → v2: "$1.5 trillion industry reshaped its strategy" → "Freeman's C-suite wasn't acting on their data." You can picture a stalled boardroom. You can't picture an industry reshaping. The $1.5T number moves to the body as supporting detail. (Harry Dry Rule 1: Visualization)
Ad 8 of 12 — "Before/After" — Video (Needs Recording)
Watch Duarte's VP of Communication take a cluttered data slide and restructure it into a clear executive recommendation in 60 seconds.
This is what your team learns in Presenting Data Insights. Two days. Their own data. Frameworks used by 200 Fortune 500 companies.
Open on a cluttered data slide — 8 metrics, 3 chart types, tiny labels. The kind everyone's made. Maegan's voice over it first, then cut to her.
This is a real slide. I pulled it from a workshop last month. Names changed, data changed, but the structure? This is what we see every single time.
[beat]
Eight metrics. Three chart types. A title that says "Q3 Performance Overview." Which tells you absolutely nothing about what the audience is supposed to do with it.
Cut to Maegan, direct to camera
So let's fix it. Right now.
Back to the slide — she starts stripping it down in real time
First question: what's the one decision this audience needs to make? Not eight. One.
Second: which two or three data points actually support that decision? Everything else is noise. I don't care how long it took to pull it. If it doesn't serve the recommendation, it's working against you.
The slide is now clean — one headline, one chart, one callout
New title: "Expanding to the Southeast will drive 40% of next year's growth." That's not a data slide. That's a recommendation.
Back to Maegan, to-camera, confident close
Same data. Completely different meeting. That's what your team learns in two days.
Version B — Spicy
Open on the cluttered slide. Full screen. Let the audience sit with it for 3 seconds. Then Maegan's voice.
Okay. I want you to look at this slide and tell me what you're supposed to do with it.
[3 seconds of silence — just the slide]
You can't. And neither could the twelve executives who sat through it last quarter.
Cut to Maegan — she's amused, not mean
This is a real slide from a real company. I've changed the numbers, but I didn't need to change the structure because they all look like this. Every single one.
Eight metrics. Three chart types. Two different Y-axes that nobody noticed are on different scales. And my personal favorite — a title that says "Q3 Performance Overview."
[leans forward]
That's not a title. That's a file name. You have accidentally named your slide the same thing you'd name the folder it lives in. And nobody in the room is going to tell you that because they're too busy trying to figure out which chart they're supposed to be looking at.
Now she's working — pulling up the slide, starting to edit
So here's what I'd do. And I'm going to do it right now because it takes about forty-five seconds.
Step one: what is the one decision this room needs to make? Not "here's the data." What do you want them to do? If you can't answer that, you're not ready to present. You're ready to send an email.
[starts deleting charts]
Step two: which data points actually prove your recommendation? Two. Maybe three. Everything else? Thank it for its service and delete it. Yes, even the one that took you four hours to pull. Especially that one. Because you are emotionally attached to it and your audience is not.
The slide is now clean — dramatic contrast with the original
New title: "Expanding to the Southeast will drive 40% of next year's growth. Here's the data."
That's a slide someone can say yes to. The other one was a slide someone could nod at politely and then never think about again.
Back to Maegan, direct, almost conspiratorial
Same data. Same meeting. Completely different outcome. That's what your team learns in two days. With their data. Not a case study. Theirs.
Because the best way to learn this is to do it with something you actually have to present on Monday.
Frameworks:
Contrast
Hook: Statement
All 4 Value Levers
Script: Maegan screen-share + to-camera, 60 seconds. Opens on a real (anonymized) cluttered slide, diagnoses it live, strips it to one recommendation. The "watch me work" proof video. Needs screen recording setup + slide asset.
v1 → v2: "Completely different outcome" → "One clear recommendation." The word "outcome" is abstract. "One clear recommendation" passes the Pointing Test. This is the only ad that hits all 4 Hormozi Value Equation levers: Dream Outcome (recommendation), Perceived Likelihood (live demo), Time Delay (60 seconds), Effort/Sacrifice (framework does the heavy lifting).
Conversion — Retargeting
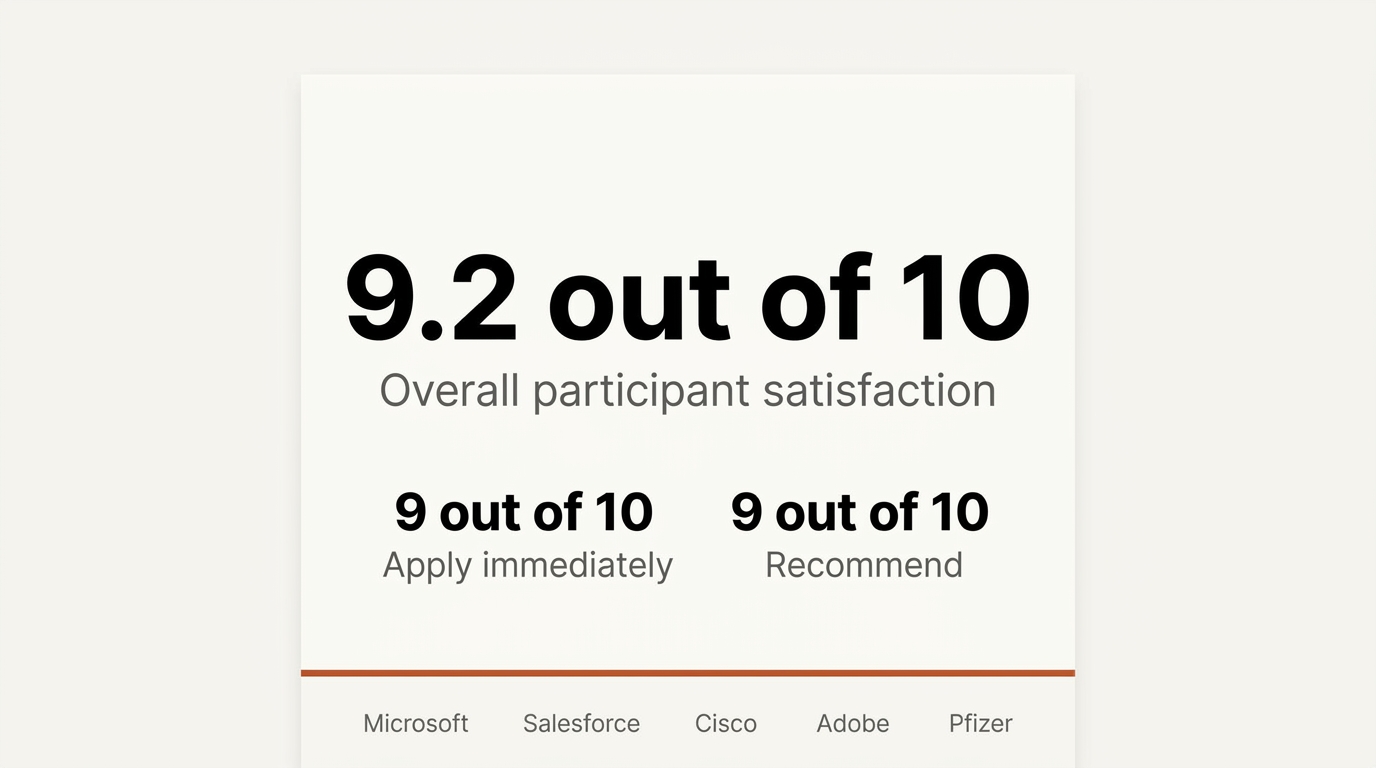
Ad 9 of 12 — "9.2 Out of 10" — Single Image (Retargeting)
That's how participants rate Duarte's Presenting Data Insights program.
9/10 apply the frameworks immediately.
9/10 recommend it to a colleague.
Trusted by Microsoft. Salesforce. Cisco. Adobe. Pfizer.
Frameworks:
AIDA (compressed)
Hook: Specificity
Value: Perceived Likelihood (max proof stack)
v1 → v2: Cut from 67 words to 37 words. Removed "Your team's next executive presentation could be the one that gets a decision in the room" — unfalsifiable aspiration. Retargeting audience already knows PDI. Proof only. (Kaplan's Law + Rule 2)
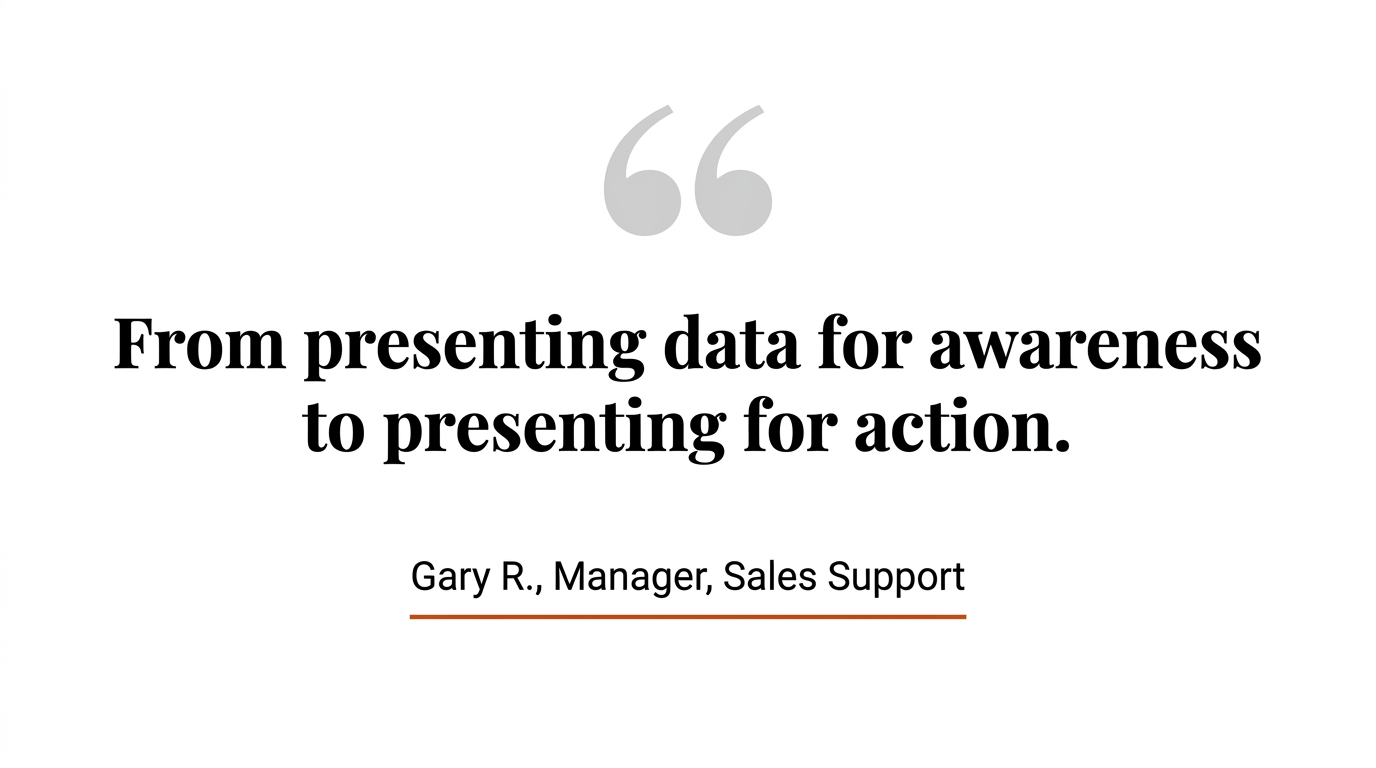
Ad 10 of 12 — "Gary R." — Testimonial
"They transformed my mindset from presenting data for awareness to presenting data for purpose and action."
— Gary R., Manager, Sales Support
Two days. Two Duarte methodologies. Your team's own data.
Frameworks:
HSO (testimonial-led)
Hook: Statement (3rd party)
Value: Perceived Likelihood + Dream Outcome
v1 → v2: Removed program description paragraph. The quote IS the ad. Everything else was working against it. Down from 51 words to 31 words. (Kaplan's Law: "Any words that aren't working for you are working against you.")
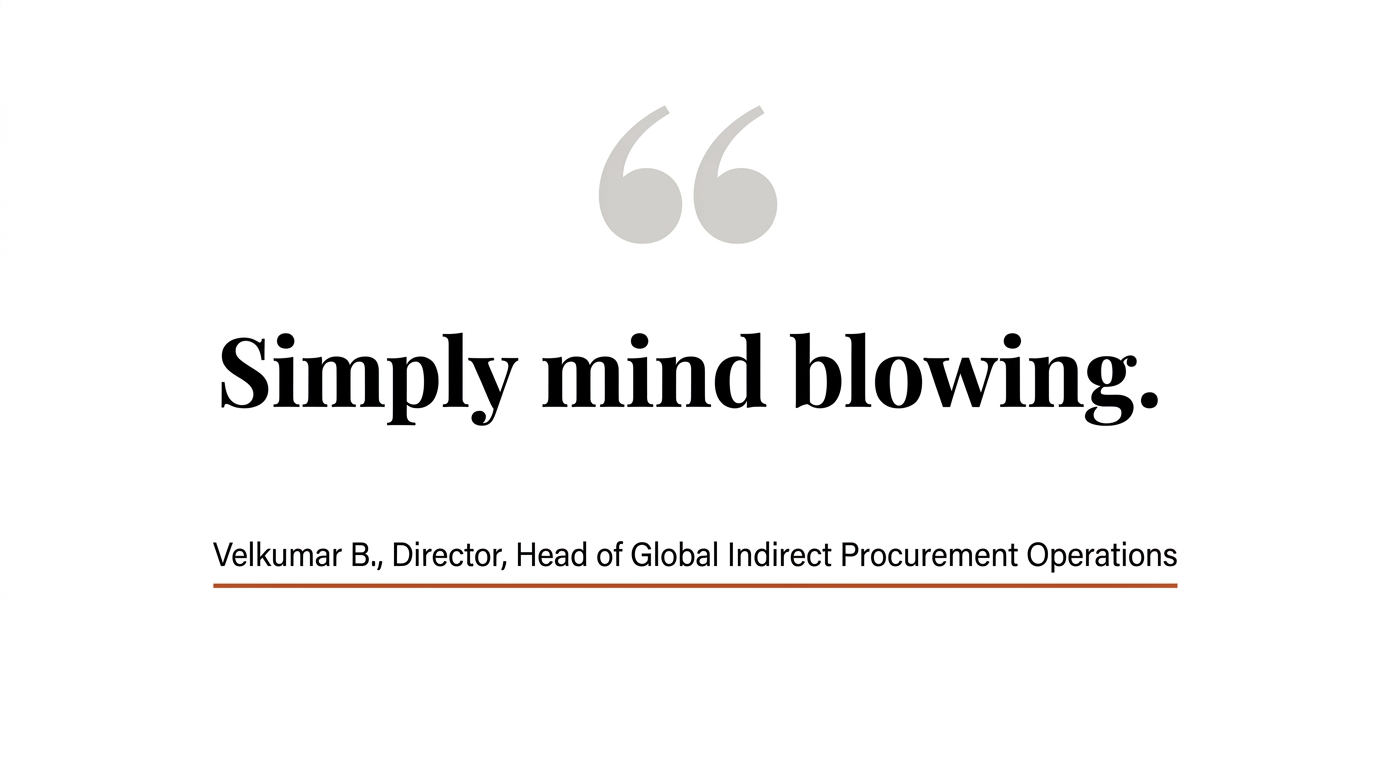
Ad 11 of 12 — "Velkumar B." — Testimonial
"If your organization has good data and your team wants to transform that data into action, I highly recommend this workshop. The methods and approach taught here is simply mind blowing."
— Velkumar B., Director, Head of Global Indirect Procurement Operations
For teams of 10 to 200+. Custom programs built around your data.
Frameworks:
HSO (testimonial-led)
Hook: Exclamation (via proxy)
Value: Perceived Likelihood + Dream Outcome
v1 → v2: Cut the second paragraph entirely ("Duarte has been training Fortune 500 teams for 35 years..."). Same principle as Ad 10. The testimonial carries the weight. (Kaplan's Law)
Thought Leader Ad
Ad 12 of 12 — Maegan Organic Post (Boosted as Thought Leader Ad)
If your team presents data to executives, you've seen this play out.
The analysis is solid. The charts are accurate. The deck is 47 slides of thorough work.
And the meeting ends with "let's circle back next week."
The data was never the problem.
The problem is the gap between having the right numbers and framing them as a recommendation that gets a yes in the room.
That's why we built Presenting Data Insights. It combines DataStory (build the narrative from your own data) with Captivate (deliver it under pressure). Two days, your team's actual numbers, coached by facilitators who've trained at 200 Fortune 500 companies.
9 out of 10 participants apply the frameworks in their very next presentation.
If this sounds like something your team needs, I'd love to hear what you're working on. Link in comments.
Like Comment Repost Send
Frameworks:
PAS (in Maegan's voice)
Hook: Conditional
Thought Leader Ad (2x CTR)
v1 → v2: Removed "I've coached hundreds of presenters at Fortune 500 companies" opening — fails Nobody Else (any coach could say this) and opens with the writer, not the reader. Now opens with "If your team presents data to executives, you've seen this play out" — starts in the reader's world. (Harry Dry Piece 1 + Rule 3)
Framework Compliance: v1 vs v2
| Test |
v1 |
v2 |
| Visualization (Rule 1) |
7/12 |
12/12 |
| Falsification (Rule 2) |
8/12 |
12/12 |
| Nobody Else (Rule 3) |
9/12 |
12/12 |
| Kaplan's Law |
6/12 |
12/12 |
| One Mississippi (headlines) |
8/12 |
12/12 |
| LinkedIn char limits |
9/12 |
12/12 |
| Value Equation (2+ levers) |
5/12 |
12/12 |
| Hook type tagged |
0/12 |
12/12 |
| Copy formula tagged |
0/12 |
12/12 |
v2 — Framework-Applied
Harry Dry Clarity (WE v3.0) + Hormozi Growth & Offer (WE v3.0) + LinkedIn Ads Playbook 2026
Prepared by Waterloo Digital | March 9, 2026